
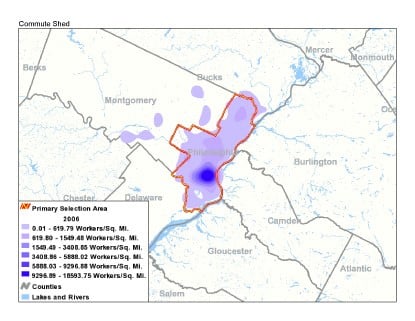
Where workers live who are employed in the Philadelphia City
The Region
Philadelphia is located on the Northeast corridor between Washington D.C. and New York City, and belongs to a primary metropolitan region that includes five Philadelphia counties and three New Jersey counties. In addition, Philadelphia is part of a larger metropolitan statistical region composed of 11 counties in four states. People who live within the metropolitan region are most likely to work within the same region.
Where workers are employed in the region who live in Philadelphia City:
Source: US Census Bureau Local Employment Dynamics On the Map
Primary Metropolitan Region Population and Employment
| Percentage of Primary | Percentage of Primary | |
| Region Population | Region Employment | |
| Burlington County, NJ | 8.7% | 8.6% |
| Camden County, NJ | 10.0% | 8.9% |
| Gloucester County, NJ | 5.5% | 4.4% |
| Bucks County, PA | 12.1% | 11.3% |
| Chester County, PA | 9.3% | 10.4% |
| Delaware County, PA | 10.8% | 8.9% |
| Montgomery County, PA | 15.1% | 20.8% |
| Philadelphia County, PA | 28.4% | 26.6% |
Source: US Census American Community Survey 2005-2007, US Bureau of Labor Statistics Quarterly Census of Employment and Wages
Metropolitan Statistical Region Population and Employment
| Percentage of MSA | Percentage MSA | |
| Population | Employment | |
| New Castle County, DE | 9.0% | 10.4% |
| Cecil County, MD | 1.7% | 1.2% |
| Burlington County, NJ | 7.7% | 7.6% |
| Camden County, NJ | 8.8% | 7.8% |
| Gloucester County, NJ | 4.8% | 3.9% |
| Salem County, NJ | 1.1% | 0.9% |
| Bucks County, PA | 10.7% | 9.9% |
| Chester County, PA | 8.2% | 9.1% |
| Delaware County, PA | 9.5% | 7.8% |
| Montgomery County, PA | 13.3% | 18.3% |
| Philadelphia County, PA | 25.0% | 23.3 |
Source: US Census American Community Survey 2005-2007, US Bureau of Labor Statistics Quarterly Census of Employment and Wages
Employment opportunities in Philadelphia City are distributed similarly to the MSA as a whole. Philadelphia City has a higher concentration of employment in healthcarea and social assistance.
Percentage of Employment by Industry in 2008
| Industry | Philadelphia | Metropolitan |
| Statistical Area | ||
| Agriculture, forestry, fishing, hunting | 0.0% | 0.3% |
| Mining | 0.0% | 0.0% |
| Utilities | 0.2% | 0.3% |
| Construction | 1.8% | 4.4% |
| Manufacturing | 4.3% | 7.8% |
| Wholesale Trade | 2.6% | 4.7% |
| Retail Trade | 7.0% | 10.9% |
| Transportation and Warehousing | 4.6% | 3.8% |
| Information | 1.9% | 2.1% |
| Finance and Insurance | 5.6% | 6.3% |
| Real Estate and Rental and Leasing | 1.5% | 1.4% |
| Professional and Technical Services | 7.3% | 7.8% |
| Managementof Companies and Enterprises | 2.1% | 1.9% |
| Administrative and Waste Services | 3.7% | 5.8% |
| Educational Services | 8.6% | 3.6% |
| Health Care and Social Assistance | 20.2% | 14.6% |
| Arts, Entertainment, and Recreation | 1.7% | 1.5% |
| Accommodation and Food Services | 7.3% | 6.6% |
| Other Services | 3.4% | 3.2% |
| Public Administration | 16.1% | 12.8% |
Source: EMSI, Inc.