- How many working age Philadelphians are there?
- How many working age adults are in the labor force?
- What are the education levels of adults in Philadelphia and Pennsylvania?
- What is the racial/ethnic composition of the working age population in Philadelphia?
How Many Working Age Philadelphians Are There?
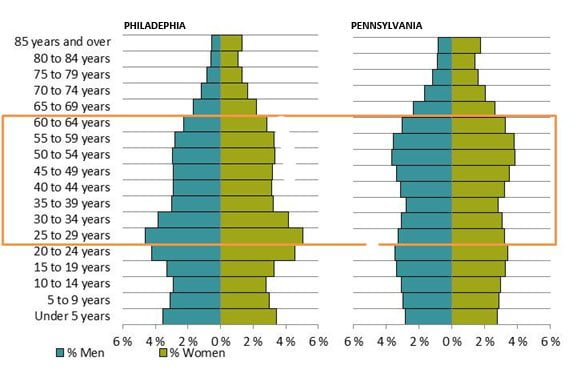
According to the 2013 population estimates, Philadelphia had 1,553,165 residents, an increase of 4,518 residents since the prior year. About 54 percent of residents are 25 to 64 or of “prime working age” and about 12 percent are 65 or older. These percentages are similar to the age distributions in Pennsylvania where 53 percent of individuals are 25 to 64 but more adults, 16 percent, are 65 and older.
The population pyramid graph below shows us the percentage of population by age group and gender. While the Philadelphia population in 2013 is “thinner” in the older age groups, the Pennsylvania pyramid is wider at the 65 years old and older populations: meaning that older adults make up a larger share of population across the state than in Philadelphia. Younger adults 25 to 34 make up a larger share of the Philadelphia population compared to all Pennsylvanians, as observed in the “bulge” on the Philadelphia population pyramid. The number of adults under 25 declined each year over the period 2010 to 2013, while the number of older adults increased slightly each year. The median age of Philadelphians was 33.8 years, compared to 40.7 years across Pennsylvania.

POPULATION PYRAMID BASED ON 2013 POPULATION ESTIMATES
Source: Philadelphia Works analysis of the U.S. Census Bureau Annual Population Estimates data.
How Is Philadelphia’s Population Changing?
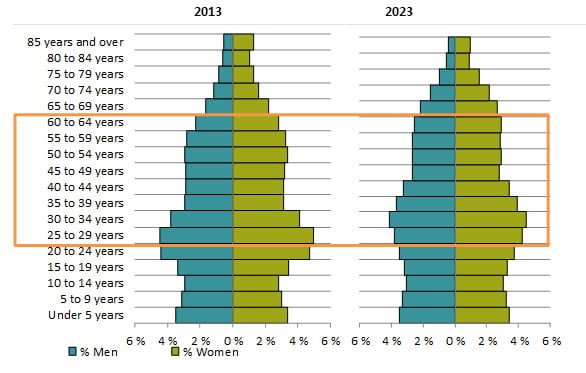
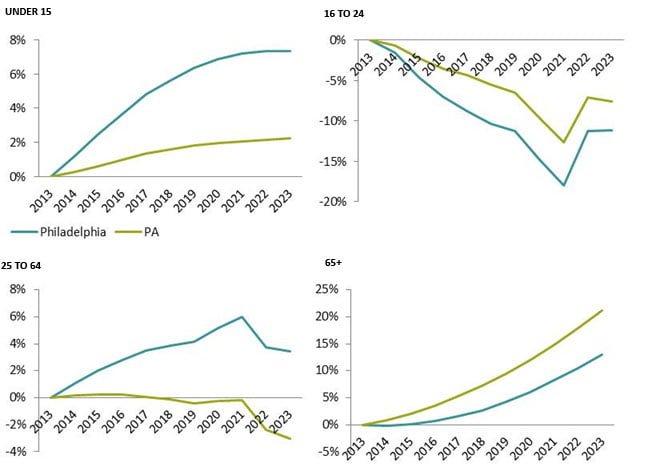
The Philadelphia population is projected to increase by 4 percent over the next 10 years. The number of adults 65 years and older is projected to increase at a faster rate, by 13 percent, while the number of young adults 16 to 24 is projected to decline 11 percent by 2023.
The working age population (25 to 64 years old) is projected to grow at a similar rate as the total population in Philadelphia: 3 percent by 2023. Over the same period, the Pennsylvania working age population is projected to decline by 3 percent. The number of older adults 65 and over in Philadelphia is projected to grow but more slowly compared to Pennsylvania. Population projections are estimates only – changes in migration, birth or death rates, or immigration rates might impact population growth.

POPULATION PYRAMID BASED ON 2013 POPULATION ESTIMATES AND 2023 POPULATION PROJECTIONS
Source: Philadelphia Works analysis of the QCEW Employees & Non-QCEW Employees – EMSI 2014.4 Class of Worker data

PERCENT CHANGE IN POPULATION FROM 2013 IN PHILADELPHIA VS. PENNSYLVANIA
Source: Philadelphia Works analysis of the QCEW Employees & Non-QCEW Employees – EMSI 2014.4 Class of Worker data
What Are the Education of Adults in Philadelphia and Pennsylvania?
The share of Philadelphia adults with a high school diploma or equivalency (33.2 percent) is similar to Pennsylvania (34.4 percent). A larger share of adults in Philadelphia did not have a high school diploma – 15.7 compared to 8.5 percent in Pennsylvania.
What is the Racial/Ethnic Composition of the Working Age Population in Philadelphia?
In Philadelphia, the racial makeup of the working age population (ages 25 to 64) was 39.4 percent Non-Hispanic White, 40 percent Black or African American, 8.9 percent Non-Hispanic Others, and 11.7 percent Hispanic. About 328,000 Non-Hispanic Black or African American made up the biggest race/ethnicity group in Philadelphia. Compared to Pennsylvania, where Non-Hispanic White accounted for 80.1 percent of the working age population, Philadelphia had a much larger share of Non-Hispanic Black or African American population.


